When your teacher reviews test scores or when you check your favorite sport team’s stats, mathematically speaking, you are working with data.
We look at data to understand patterns, make comparisons, or make decisions based on the information it provides us with. Some of the “tools” that can help you make sense of this data are mean, mode, median, and range.
We’ve put together this kid-friendly overview to introduce you to the mean, mode, median, and range in mathematics. Find simple definitions, easy-to-follow examples, and a fun quiz to test your skills, plus, click to explore detailed guides to each concept.
Find Top-Rated Statistics Tutors Near You
What Are Measures of Central Tendency?
Measures of central tendency are tools that help us find the central or typical value of a dataset.
To put it simply, they give us a single value, or one number, that summarizes a large set of numbers and makes it easier to understand the overall trend or average.
There are three measures of central tendency:
- Mean
- Mode
- Median
What Is Mean in Math?
The mean is the average of a set of two or more values.
You’ve likely heard it referred to as the average.
We find it simply by adding all the values and dividing the sum by how many values there are.
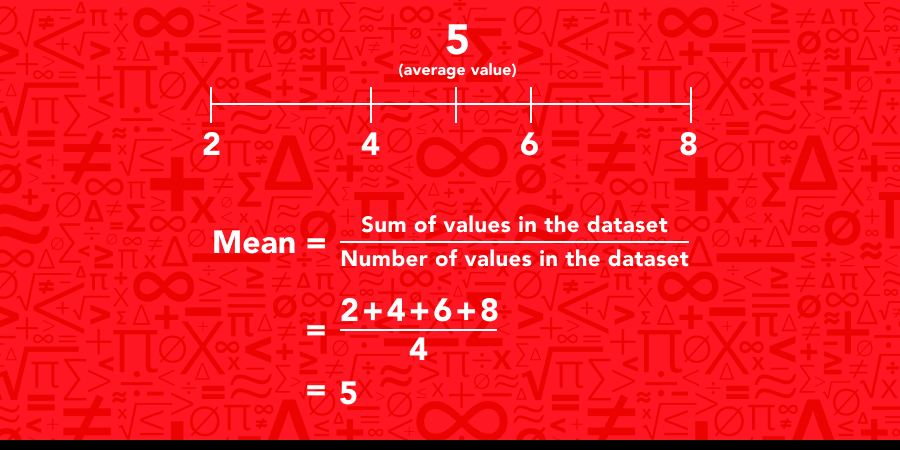
If you have the numbers 2, 4, 6, and 8, what is the mean?
We begin by adding all the numbers together:
2 + 4 + 6 + 8 = 20
Then we divide by how many numbers there are to get the mean:
20 ÷ 4 = 5 :
So, the mean is 5.

Explore the Mean, Including Definitions, Solved Examples, and Exercises →
What Is Mode in Math?
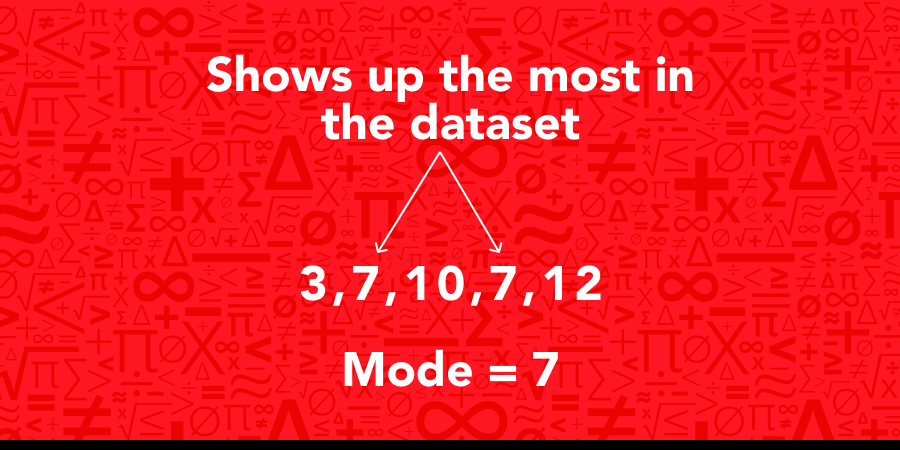
The mode is the value that occurs most frequently in a dataset.
For example, in the dataset 3, 7, 10, 7, and 12, the mode is 7 because it appears more times than any other value.

What Is Median in Math?
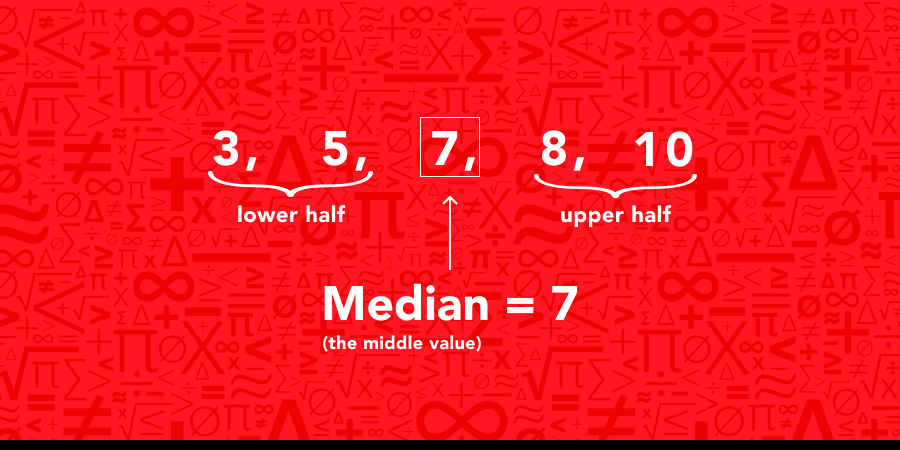
The median is the middle value in a dataset arranged from smallest to largest.
In other words, if you have a set of numbers and you organize them from the smallest to the largest, the median is the value that separates the upper half from the lower half.
Let's take a look at this dataset: 8, 3, 10, 5, and 7.
First, we can arrange the numbers in order: 3, 5, 7, 8, 10.
In this case, the middle value is 7, which is the median.

Explore the Median, Including Definitions, Solved Examples, and Exercises →
What Is Range in Math?
While the mean, mode, and median help us understand the center of a dataset, the range tells us how spread out the values are.
The range measures the difference between the smallest and largest values in a dataset.
For example, let’s look at this simple dataset: 1, 2, 3, 4, and 5.
The range here is the difference between the largest value, 5, and the smallest value, 1: 5 − 1 = 4.

Explore the Range, Including Definitions, Solved Examples, and Exercises →
How Do We Use Mean, Mode, Median & Range in Daily Life?
Mean, mode, median, and range are more than just math concepts—they’re tools we use to make sense of everyday numbers and make smarter decisions.
Let’s explore several examples of how these concepts come into play in our daily lives.
Mean in Daily Life
Think of checking ratings for a game you want to play or a movie you’d like to watch. When you see results like 3.4 or 4.7, these ratings are based on the mean.
They’re calculated by adding up all the ratings and dividing by the number of reviews to get the mean, or as we tend to call it, the average rating.
We usually calculate video game and mobile app ratings by looking for the mean of all the reviews.
Mode in Daily Life
Imagine an ice cream store owner who wants to find out which flavor sold the most on the opening day.
She notes that the store sold 40 vanilla cones, 30 chocolate, and 20 strawberry. Since vanilla is the flavor that appears the most times in her records, it is the mode for ice cream sales.
Based on this information, what flavor do you think our ice cream store owner will sell the most of the next day?
Vanilla, of course! 🍦
We can use the mode to find out the best-selling ice cream flavor and decide which ice cream to stock up on.
Median in Daily Life
In sports like basketball or soccer, coaches use the median to see a player's typical performance.
For instance, if a soccer player scored 1, 0, 2, 2, 1, 7, and 2 goals in different games, the median is 2. This gives a clearer picture of the player's usual performance without being affected by extreme high or low scores.
In basketball, we use the median to understand a player’s typical performance.
Range in Daily Life
Understanding the range of prices helps us make smarter choices in everyday shopping.
Imagine you’re at the grocery store and see cereal prices ranging from $2.00 to $10.00. Once we subtract $2 from $10, we will know that the prices range by $8.
This may help you decide which cereal box to buy. Are you willing to pay $8 dollars more for the most expensive box, or would you rather pick one that is in the middle of this price range?
Checking out the cereal price range at your local supermarket is a great example of range measurement.
How Do We Calculate Mean, Mode, Median & Range in Math?
We’ve seen how mean, mode, median, and range show math in action.
Now, to help you build a deeper understanding of these concepts, we’ve prepared a clear table to show you how each one is calculated and how they compare to each other.
|
Concept
|
How to Calculate
|
Example Dataset
|
Steps
|
|
Mean
|
Add all values and divide by the number of values.
|
4, 8, 6, 2, 10
|
1. Add the values: 4 + 8 + 6 + 2 + 10 = 30
2. Divide by the number of values: 30 ÷ 5 = 6
Mean = 6
|
|
Mode
|
Find the value that appears most often.
|
3, 5, 3, 8, 10, 3, 6
|
1. Arrange in order: 3, 3, 3, 5, 6, 8, 10
2. Identify the value that appears most frequently (3 appears 3 times)
Mode = 3
|
|
Median (Odd Dataset)
|
Arrange the values in order and find the middle value.
|
3, 9, 6, 2, 8
|
1. Arrange in order: 2, 3, 6, 8, 9
2. Find the middle value: 6
Median = 6
|
|
Median (Even Dataset)
|
When the dataset has an even number of values, find the middle two values and take their average.
|
4, 6, 8, 10
|
1. Arrange in order: 4, 6, 8, 10
2. Find the two middle values: 6 and 8
3. Take their average: (6 + 8) ÷ 2 = 7
Median = 7
|
|
Range
|
Subtract the smallest value from the largest value.
|
4, 15, 6, 10, 7
|
1. Find the largest value: 15
2. Find the smallest value: 4
3. Subtract: 15 - 4 = 11
Range = 11
|
Solved Example: Mean, Mode, Median, and Range
To solidify our understanding, we’ll find the mean, mode, median, and range using the same dataset.
Dataset:
25, 10, 22, 30, 15, 12, 20, 18, 20
Mean
To find the mean:
-
Add all the values together:
25 + 10 + 22 + 30 + 15 + 12 + 20 + 18 + 20 = 172
-
Count the number of values:
There are 9 values.
-
Divide the sum by the number of values:
172 ÷ 9 = 19.11
Mean = 19.11
Mode
To find the mode:
-
Arrange the values in order:
10, 12, 15, 18, 20, 20, 22, 25, 30
2. List the values and count how many times each appears:
- 10 appears once
- 12 appears once
- 15 appears once
- 18 appears once
- 20 appears twice
- 22 appears once
- 25 appears once
- 30 appears once
-
The mode is the value that appears the most:
Mode = 20
Median
To find the median:
-
Arrange the values in order:
10, 12, 15, 18, 20, 20, 22, 25, 30
-
Find the middle value:
Since there are 9 values, the middle value is the 5th in the ordered list.
10, 12, 15, 18, 20, 20, 22, 25, 30
Median = 20
Range
-
Look at the dataset to find the largest and smallest values:
10, 12, 15, 18, 20, 20, 22, 25, 30
- The largest value is 30
- The smallest value is 10
-
Subtract the smallest value from the largest:
30 − 10 = 20
Range = 20
Flash Quiz!
1) You and your friends are voting for the best video game during lunch break. Out of 10 friends, 4 choose Fortnite, 3 pick Minecraft, 2 go for Among Us, and 1 votes for Roblox. What math term best describes the most popular choice?
A) Mode
B) Mean
C) Median
D) Range
2) If a dataset has an even number of values, how do you find the median?
A) Add all the values together and divide by how many there are.
B) Find the middle two values, then take their average.
C) Subtract the smallest value from the largest.
D) Find the value that appears most often.
3) What happens to the median if you add a very large number to a dataset?
A) It always increases.
B) It always decreases.
C) It stays the same if the number of values is even.
D) It could shift, depending on the position of the new number.
4) If you want to find the average score of your last 5 tests, which math concept would you use?
A) Mode
B) Median
C) Range
D) Mean
5) How does adding a new value that falls between the current smallest and largest values in a dataset affect the range?
A) The range increases.
B) The range decreases.
C) The range stays the same.
D) The range becomes zero.
FAQs about Mean, Mode, Median, and Range
We've put together some frequently asked questions about mean, mode, median, and range to help you understand these concepts even better.
1) Why do students learn about mean, mode, median & range?
Learning about mean, mode, median, and range helps you make sense of numbers and data in everyday life. These concepts are like tools in a toolbox that help you:
-
Understand Averages: The mean helps you find the average of numbers, making it easier to see overall trends.
-
Spot Patterns: The mode shows you the most common value in a dataset, which can be useful for identifying trends.
-
Find Middle Values: The median helps you understand the middle point of a dataset, giving you a clearer view of what’s typical.
-
Measure Spread: The range shows how spread out the numbers are, which can help you understand the variability in data.
2) When do students learn about mean, mode, median, and range in school?
Students typically start learning about mean, mode, median, and range in middle school, around grade 6. These concepts are introduced as part of the curriculum to help students understand data and statistics.
In these early lessons, you’ll learn how to calculate and use these measures to analyze data, make comparisons, and solve real-world problems. As you advance in school, you’ll build on these basics to explore more complex statistical concepts and data analysis techniques.
3) Can the mean, mode, and median be the same for a dataset?
Yes, in some cases, the mean, mode, median, and range can be the same. For example, if you have a dataset like 2, 4, 6, 6, 8, 10 then the mean, mode, and median are all 6.
4) When should we use the median and when the mean?
The median can be more useful than the mean when dealing with datasets that have outliers or extreme values. Since the median is the middle value, it isn’t affected by extremely high or low numbers, which makes it a better measure of the typical value in such cases.
On the other hand, the mean is useful when you want a quick average, and your data is evenly distributed without any extreme values.
Master K-12 Math with Mathnasium
Mathnasium is a math-only learning center that provides face-to-face instruction in an engaging group environment to help students achieve math mastery.
Our specially trained math tutors work with K-12 students, including middle schoolers, of all skill levels to help them learn and master any math class and topic, including mean, mode, median, and range.
Discover our approach to middle school math tutoring:
At Mathnasium, we assess each student’s current skills and consider their unique needs and academic goals to create personalized learning plans that will put them on the best path towards math mastery.
Whether you are looking to catch up, keep up, or get ahead in your math class, find a Mathnasium Learning Center near you, schedule an assessment, and enroll today!
Find a Math Tutor Near You
Psst! Check Your Answers
If you have given our flash quiz a go, check your answers here:
-
Question 1 – A)
-
Question 2 – B)
-
Question 3 – D)
-
Question 4 – D)
-
Question 5 – C)
How did you do?


