You may not know it, but you are using the concept of range almost every day.
For example, when you are trying to figure out how old someone is, you are looking for the range between the year they were born and the present year; When you are deciding on the cereal to buy, you might evaluate the range of prices, from the cheapest to the most expensive box; and so on.
Range is simply the distance between two extremes. In this guide, we will show you exactly what range is, how we calculate it, and how we use it outside the classroom.
Let’s dig in!
What Is the Range?
The range is a measurement which helps us find the difference between the smallest and largest values in a dataset.
Let’s say that the smallest number on our number line is 1 and the largest is 5, like so:
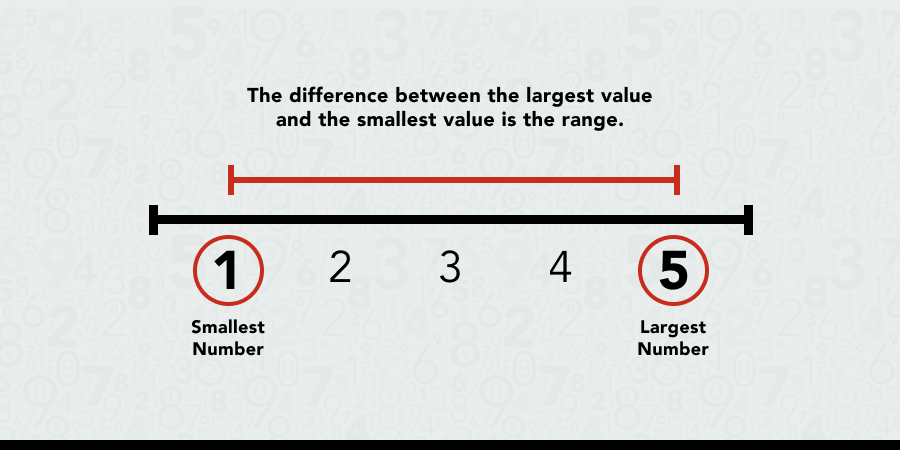
We will find our range by subtracting the smallest value from the largest one, so 5 – 1 = 4. The range on our number line is 4.
Or, say we want to determine the height range in our group of friends.
We take everyone’s height and find that the tallest friend is 73", and the shortest is 60".
The range of heights between the tallest and the shortest friend in our group is 13".
Find Top-Rated Middle School Tutors at Mathnasium
Similar Concepts
We have a few more concepts in addition to range that help us measure and describe the data in our dataset:
- Mean: The average value of a dataset
- Median:The middle value in a dataset once the numbers are in order
- Mode: The most frequently occurring number in a dataset
Students typically encounter these concepts within the same statistical unit in middle school as they start preparing for high school math.

Calculating the range will give you the difference between the shortest and tallest student in this group.
When Do Students Typically Explore Range?
Students will typically learn about range in elementary school math. This is when 4th and 5th grade students will start to gain a basic understanding of statistical concepts like data measurement and analysis.
How Do We Use the Range in Everyday Life?
We use range to describe the spread of our dataset; for example, the lowest and highest temperatures we can expect today, or the youngest and the oldest member of our sports team.
We also use range to make decisions.
Imagine you're at the grocery store looking for cereal to buy. You quickly scan the prices and notice that the cheapest box is $2.00, while the most expensive is $10.00. Once we subtract $2 from $10, we will know that the prices range by $8.
Knowing the price range can help you decide which cereal box to buy; Are you willing to pay $8 dollars more for the most expensive box, or would you prefer to buy one that is in the middle of this price range?

Understanding the cereal price range at your local supermarket is a great example of range measurement.
Another good example is sports games.
If over a series of games, the lowest score of your basketball team is 86 points and the highest is 111 points, the range of 25 points tells you how much the team's performance varied over the games they played.
How Do We Find the Range?
We’ve mentioned the word “dataset” several times by now.
Dataset simply means that you have a set of related data, such as heights of students in your class, or morning and evening temperatures recorded each day at the same times for the past week.
Before measuring the range, we could organize our dataset in ascending or descending order so we can easily spot the lowest and the highest values. Once we know these, measuring the range is as easy as subtracting the lowest value from the highest one.
Let's go back to our cereal box example. Imagine you’ve just reached the cereal aisle, and you are scanning the shelves left to right, checking the prices:
- $3
- $7
- $4.50
- $2
- $10
- $3.50
- $8
- $5
To figure out the price range, we can organize this dataset of cereal box prices by identifying the smallest and the largest values:
- $2
- $3
- $3.50
- $4.50
- $5
- $7
- $8
- $10
Now that we have our dataset organized in an ascending order, we can see that our cheapest box is $2 and the most expensive one is $10.
The price of cereal ranges by $8 in our store.
Another good example is the weather.
Let’s say you are thinking about what to wear to school tomorrow. You check the weather forecast and it says that the temperature in the morning will be 65°F and by lunchtime, it’ll reach 80°F.
To find the range, we subtract the lowest from the highest temperature: 80°F - 63°F = 17°F.
Now that we know that the temperature will vary by 17°F, which can be a significant difference, we may decide to layer up so that we are ready for both the chilly morning and the warm afternoon.

Understanding temperature range can help you determine what to wear for the day.
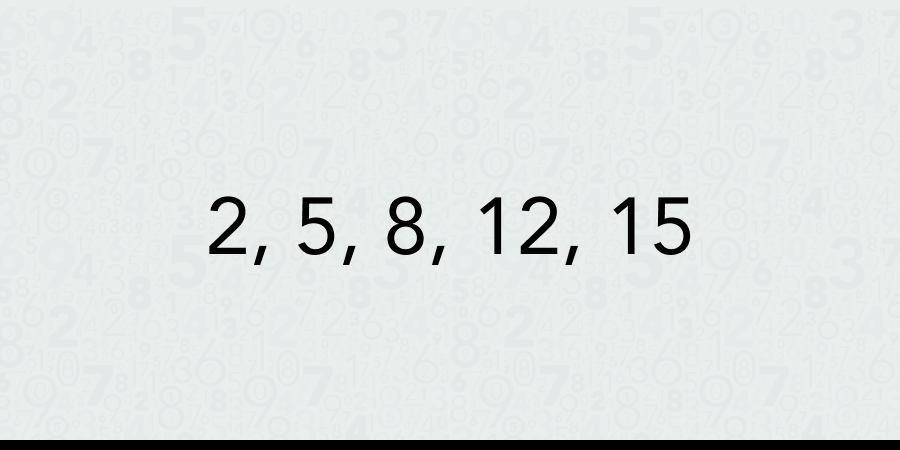
In class, you will probably start learning how to measure range with datasets containing simple values like so: 5, 12, 8, 15, 2
Step one is to organize our data in ascending or descending order.
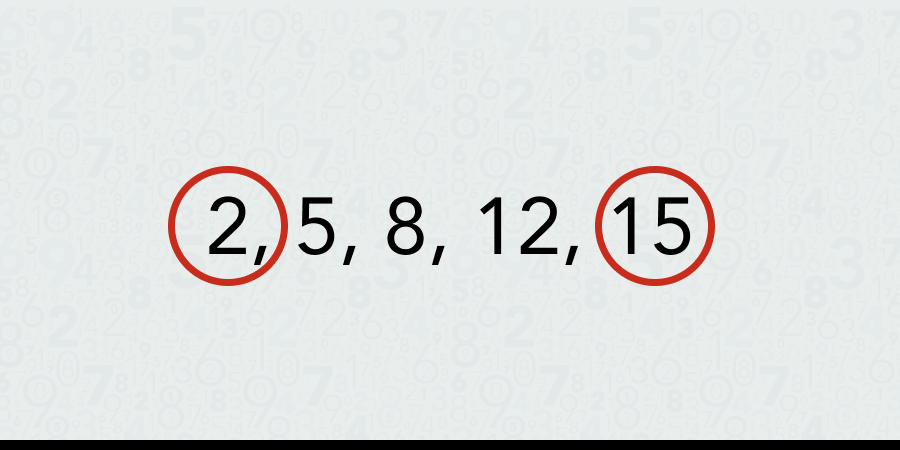
Step two is to identify the extremes which, in this case, are 2 and 15.
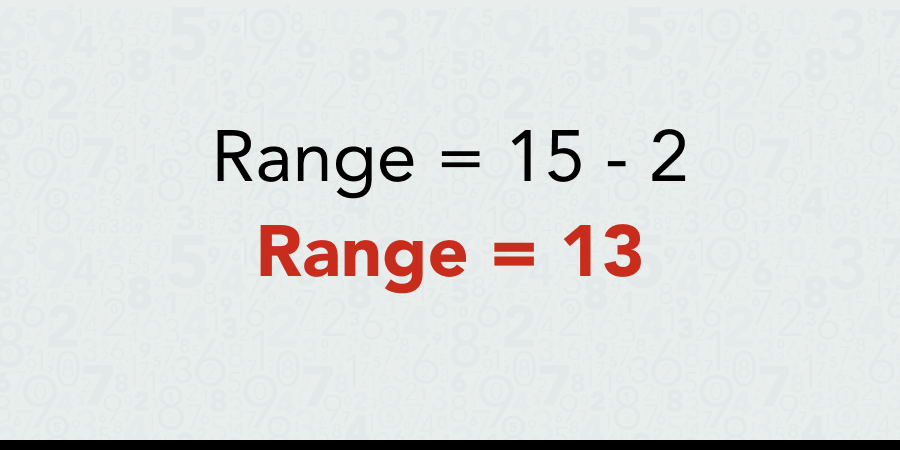
Step three is to calculate the range by subtracting the lowest value, 2, from the highest value, 15, which comes to 13.
Makes sense?
Let’s recap the steps:
- Order: Arrange the numbers in the dataset from in ascending or descending order.
- Identify the extremes: Pinpoint the smallest and largest values in the ordered dataset.
- Calculate: Subtract the smallest value from the largest value. This difference is the range.
Common Mistakes to Look Out for
When learning to measure the range, there are a few common mistakes that can be overlooked including:
- The wrong minimum or maximum values: Make sure to double-check that you've correctly identified the smallest and largest values in the dataset.
- Incorrectly subtracting: Make sure you're subtracting the smallest value from the largest value, not the other way around.
Give It a Go: Find the Range Yourself
Over to you! Here are some datasets you can use to practice finding the range.
Once you’ve found the range for each dataset, scroll to the end of this guide to check your answers.
Find the ranges for these 5 datasets:
- Dataset A: 5, 9, 4, 3, 2, 6
- Dataset B: 25, 12, 34, 20, 19, 10
- Dataset C: 45, 10, 9, 1, 22, 5
- Dataset D: 90, 55, 30, 84, 67, 79
- Dataset E: 144, 189, 43, 24, 193, 103
Were you able to find the range for the datasets? Scroll down to find out if you got them correct.
Frequently Asked Questions About the Range
Here are the most common questions Mathnasium’s tutors get about range in math.
1) When do students learn about the range in school?
Students are typically introduced to the range in middle and high school in classes like algebra, geometry, and statistics.
2) Can you find the range in a set with negative numbers?
Yes, you can find the range in a set with negative numbers. We can calculate range regardless of whether the numbers in our dataset are positive, negative, or a combination of the two.
3) What is the range when all numbers in the data set are the same?
When all numbers in a dataset are the same, the range is 0. This means that when there's no difference between the largest and smallest values.
For example, if you have a dataset of: 10, 10, 10, 10 the range would be 10 - 10 = 0.
Practice with Top-Rated Math Tutors Near You
Mathnasium’s specially trained tutors work with students of all skill levels to help them understand and excel in any K-12 math class, including statistics and topics such as range.
Explore our approach to middle school math tutoring:
At Mathnasium, students follow personalized learning plan tailored to their individual needs and goals, ensuring they receive the support necessary to achieve math mastery.
Whether you are looking to catch up, keep up, or get ahead in your math class, find a Mathnasium Learning Center near you, schedule an assessment, and enroll today!
Find a Math Tutor Near You
Psst! Check Your Answers
If you have given our exercise a go, check your answers here:
- Dataset A: Range = 7
- Dataset B: Range = 24
- Dataset C: Range = 44
- Dataset D: Range = 60
- Dataset E: Range = 175
How did you do?